
The first post in this series ended with a promise: FreeSBC’s capacity numbers would get their own post, with the setup next to them. Here they are. On one 4 vCPU cloud VM, FreeSBC v0.5.0 relayed 5000 concurrent G.711 calls with both media legs anchored, set up 3500 calls per second from a carrier without loss, added less than 1 ms to call setup, and ran 8 hours at 3500 concurrent calls with no growth in goroutines, memory, file descriptors or ports.
FreeSBC is a pure-Go SIP/WebRTC edge proxy: one binary, one YAML file. It anchors RTP, does no transcoding, and terminates ICE-Lite and DTLS-SRTP for browsers. Every number below comes from one formal three-host run on 2026-10-18 and 2026-10-19, and the harness that produced them is in the repository.
I have not run Kamailio, OpenSIPS, rtpengine or a commercial SBC on the same rig, so this post does not say FreeSBC is faster than any of them. It gives numbers in units you can hold against your own: calls per vCPU, call setups per second on 4 vCPU, added latency, and drift over 8 hours. It also re-runs one commercial SBC’s own published test.
The numbers#
| What | Result on 4 vCPU | Kind |
|---|---|---|
| Concurrent G.711 calls, both legs anchored | 5000, CPU 310 of 400 | knee at the 80% CPU line |
| Call setup, carrier to switch | 3500 CPS, loss-free | knee |
| Call setup, switch to carrier | 3250 CPS | knee |
| Call setup, client to switch | 2250 CPS or more | lower bound |
| Latency added to INVITE → 200 | below 1 ms | measured |
| 8 h soak at 3500 concurrent calls | 432,000 calls, 0 failed, no growth | measured |
| Registrations held / refreshed | 19,000 / 20,000 REGISTER/s or more | lower bound |
| WebRTC, DTLS-SRTP | 100 handshakes/s, 600 calls, or more | lower bound |
| FreeSWITCH 1.10.0 as the switch | 3000 calls, 1500 CPS, or more | lower bound |
A knee is the last step before the first one that failed the pass line. A lower bound means the generator, the switch or the test range ran out before FreeSBC did.
The rig#
Three cloud VMs on Alibaba Cloud, all Ubuntu 24.04 on kernel 6.8, with real NICs on two subnets of one private network. One subnet plays the public side, the other the private side. The instance types and CPUs:
- FreeSBC: ecs.c9i.xlarge, Intel Xeon 6982P-C, 4 vCPU (2 physical cores
with hyper-threading), 7.4 GiB usable. v0.5.0, Go 1.27.2, sipgo v1.6.0,
GOMEMLIMIT=6GiB. - Load generator: ecs.c8a.2xlarge, AMD EPYC 9T24, 8 vCPU, running SIPp
3.6.1 and
webrtcload, the repository’s WebRTC load client. - Switch: ecs.c9i.2xlarge, Xeon 6982P-C, 8 vCPU, running a SIPp UAS that answers at once and echoes RTP, or FreeSWITCH 1.10.0 for one set of runs.
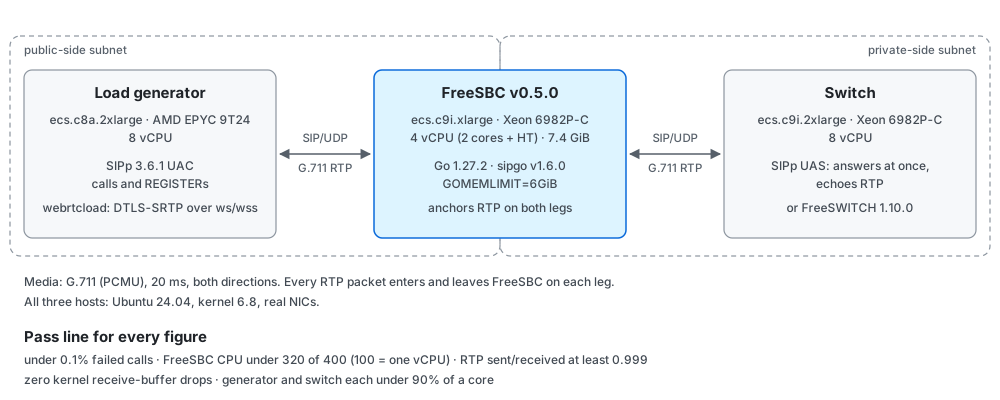
Signaling is UDP. Media is G.711 at 20 ms, in both directions, with both legs anchored by FreeSBC, so every RTP packet enters and leaves FreeSBC on each leg. FreeSBC was restarted before each ladder value.
A figure only counts if its run had under 0.1% failed calls, FreeSBC under 80% of its cores, RTP sent over received of at least 0.999 with zero kernel receive-buffer errors, and the generator and the switch each under 90% of a core. CPU is quoted with 100 meaning one vCPU, so the line on this box is 320 of 400. The last check matters most. SIPp is mostly single-threaded per instance, and a fast proxy measured with a saturated generator looks like a slow proxy.
Media: about 1600 calls per vCPU#
The concurrent-call ladder stepped from 250 to 5500 calls, each with a 60 s ramp and two 60 s holds. CPU grew in a straight line: 20 at 250 calls, 130 at 2000, 251 at 4000. At 5000 calls it was 310 average and 338 peak, with 500,588 RTP packets per second each way, 373 MB of RSS and 0 failed calls. That is 668 Mbit/s each way. At 5500 the CPU crossed the line and the generator’s SIPp was at 94% of a core, so the figure is 5000, or slightly more, generator-bound above.
Divided out, that is about 1600 concurrent calls per vCPU, and about 0.07 MB of RSS per call, baseline included. The per-vCPU figure is arithmetic: only the 4 vCPU size ran this ladder.
The profile at 5000 calls shows where the CPU goes:
85% cumulative in the forward loop, and about 66 to 70% flat in the
sendto and recvfrom syscalls. One packet in, one packet
out, one syscall each. GC is not among the top entries. Batching the
syscalls per socket would save few of them, so that issue
was closed as not worth it at this architecture.
Signaling: thousands of setups per second, under 5 ms#
The call-setup ladders run without media, with 2 s calls, in 40 s steps from 250 CPS, one per direction. Each knee then got a confirm run at 90% of it for 120 s.
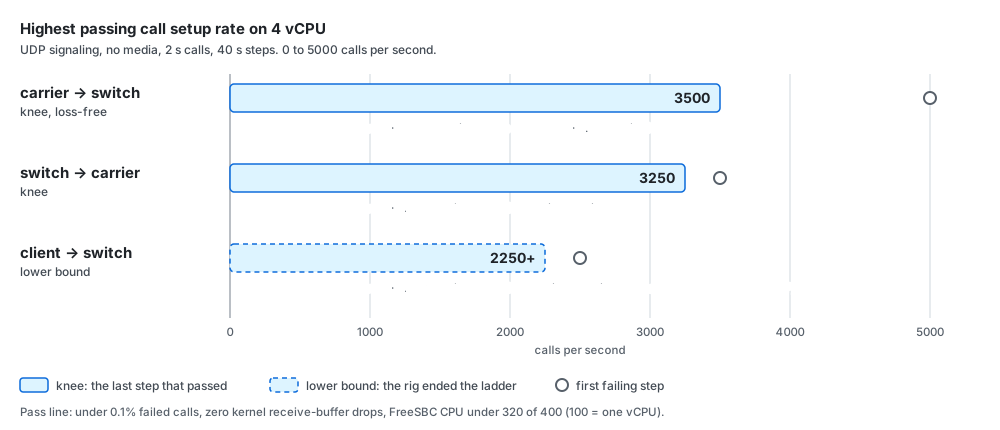
- Carrier to switch: 3500 CPS. CPU averaged 190 of 400 at the knee, with 4296 MB of RSS. Calls kept succeeding past it: 0.047% failed at 4750 CPS, and the first failing step was 5000. What ends the loss-free range is the kernel dropping datagrams on FreeSBC’s UDP receive buffers from 3750 CPS, while the CPU was at 209 to 265 of 400. That is a receive-path limit, open as #235.
- Switch to carrier: 3250 CPS. At 3500 the carrier leg timed out on 0.204% of calls.
- Client to switch: 2250 CPS or more. This one is a floor. FreeSBC allows 64 unanswered INVITEs per public source IP, and the generator has one IP. At 2500 CPS all 248 failures were that cap, with FreeSBC at 37% CPU.
None of the three knees is a CPU limit: FreeSBC averaged 33 to 48% of its CPU at all of them. The confirm runs passed every call: 243,000 at 2025 CPS, 378,000 at 3150 and 351,000 at 2925, with INVITE-to-200 p95 under 5 ms at the knees.
FreeSBC’s own share of that latency was measured separately at 1000 concurrent calls. INVITE to 200 averaged 3.0 ms through FreeSBC and 3.0 ms straight to the switch. The difference is below SIPp’s 1 ms resolution.
It doesn’t drift#
A proxy that leaks a little per call passes every ladder and fails a week later. The soak held 3500 concurrent calls, 70% of the media maximum, for 8 hours: 15 new calls per second, each held 240 s. The results:
- 432,000 calls, 0 failed, 0 retransmissions.
- CPU 235 average, 245 peak, out of 400.
- From the first quarter of the run to the last: goroutines +0.0%, RSS −0.3%, open file descriptors +0.0%, ports in use +0.0%. RSS peaked at 240 MB.
- 10.37 billion RTP packets each way, sent over received 1.0000.
- After the load stopped: 33 goroutines, 13 file descriptors, 0 media ports.
The soak report has the raw medians: 22,113 goroutines in the first quarter and 22,113 in the last. No host was reclaimed or rebooted during the 8 hours.
A commercial SBC’s own test, on one vCPU#
One commercial SBC vendor publishes a load test of its own product: 50 calls per second up to 1000 concurrent calls, each held 600 s, on a Xeon X5670 with 6 cores and 12 threads, 8 GB of RAM and Debian 10. The published result is “Used Memory 1730M, CPU Load 26%”. I am not naming the vendor. The test is the useful part.
The harness reproduces that test: 2000 calls, G.711 both ways on both legs, a plateau of about 1180 s. It ran on all four vCPU, then with FreeSBC limited to two, then to one. The results:
| FreeSBC cores | Failed | CPU avg / peak (100 = one vCPU) | RSS max | Verdict |
|---|---|---|---|---|
| 4 vCPU | 0 of 2000 | 64 / 70 | 120 MB | PASS |
| 2 | 0 of 2000 | 52 / 57 | 117 MB | PASS |
| 1 | 0 of 2000 | 40 / 44 | 115 MB | PASS |
Probe calls inside the plateau measured 0.000% loss and 0.47 ms mean jitter. So one vCPU of this box carries the vendor’s test at 40% of that vCPU. CPU is lower on one core than on four because with one core the Go runtime has no idle processors spinning.
Four caveats before reading more into it:
- I ran FreeSBC. I did not run the vendor’s product; its numbers are as published.
- The vendor does not define “CPU Load 26%”: it could be one core, all twelve threads, or a load average.
- “Used Memory 1730M” is host memory. The comparable figure is the whole FreeSBC host at 855 MB used, not FreeSBC’s 120 MB RSS. The whole host’s CPU averaged 15.9% of its vCPUs.
- The hardware is from different generations. The test plan estimates the two boxes as roughly comparable in total compute, or this one somewhat lower: fewer cores here, each much faster than a 2010-era Westmere core.
The 32-second goroutine#
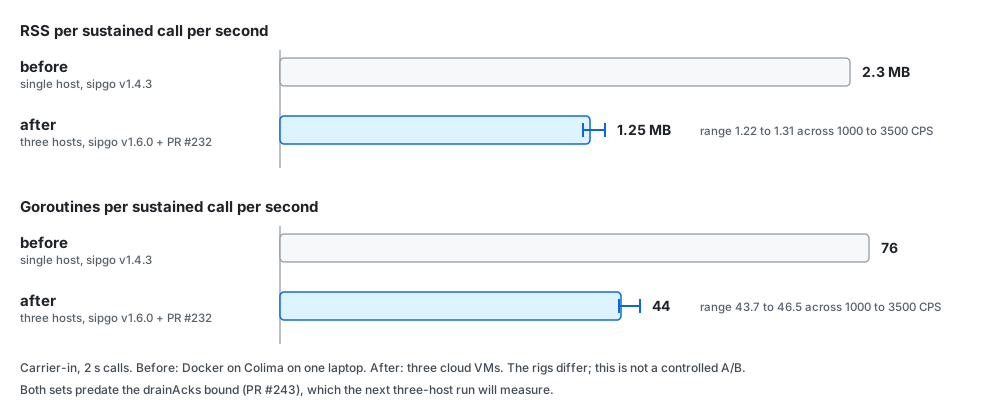
The earliest numbers had a problem the three-host run no longer shows. The
first run was a single host, Docker on a laptop, with sipgo v1.4.3. At 2500
CPS FreeSBC had 189,159 goroutines, and 159,195 of them (84%) sat in one
stack: sipgo’s TerminateGracefully, waiting about 32 s for each
finished transaction’s timers. That cost about 76 goroutines and 2.3 MB of
RSS per sustained call per second, and at 3500 CPS the process was killed
at its 8 GiB limit.
Two changes removed it. sipgo v1.6.0 returns from
TerminateGracefully at once for a finished UDP transaction and leaves the
rest to its timers. PR #232 stopped ended dialogs from staying
reachable through OnCancel, watch2xx and backstop timers
(#228).
On the three-host rig, RSS came out at 1.22 to 1.31 MB per sustained CPS, and goroutines at 43.7 to 46.5, flat from 1000 to 3500 CPS. Flat is the point: the cost is per call, held for a fixed time, and goroutines fall back to about 33 after each run. It is not a leak. The before and after come from different rigs, one laptop against three VMs, so this is not a controlled comparison.
What remains is mostly heap. sipgo keeps each UDP transaction, with its
request and response, for 32 s after a 2xx: Timer L, RFC 6026’s Accepted
state. I left that alone on purpose; it is sipgo’s to
change. Of the 44 goroutines per CPS, 31.7 were FreeSBC’s own
drainAcks, waiting the same 32 s for an ACK that
follows a 2xx by one round trip. PR #243 bounds that wait at 8 s,
which cut goroutines per CPS from 32.1 to 8.1 in a local in-process
test. It landed after the run, so every figure in this post
predates it. The next three-host run will measure it.
What I am not claiming#
- Other sizes. Only 4 vCPU was measured; one and two vCPU ran only the 1000-call test above. Per-vCPU figures are division.
- Statistics. Each ladder ran once, with one confirm run per knee. There are no confidence intervals.
- Client call rate. 2250 CPS is bounded by one source IP, not by FreeSBC.
- Carrier-in above 3500 CPS. The kernel drops datagrams from 3750 CPS while FreeSBC is at 52 to 66% CPU. The cause is open in #235.
- Signaling CPU. About half is in sipgo’s transaction layer, and GC takes 20 to 23%. Allocation per request is open in #173.
- Untested paths. SIP over TCP and TLS, SDES-SRTP, and switch-to-client calls were not loaded.
- Memory at high call rates. Memory follows calls per second, not concurrent calls. At 5000 CPS carrier-in RSS reached 5.8 GB on this 7.4 GiB host.
- Other proxies. No other open-source SBC or proxy was run on this rig.
Sizing, and how to rerun it#
A rule of thumb for this hardware class, from the sizing guide:
- Media: about 1600 anchored G.711 calls per vCPU, and about 0.07 MB of RAM per call.
- Call rate: about 1.2 GB of RAM per 1000 sustained CPS, plus
headroom. Set
GOMEMLIMITto 80 to 90% of the memory the process may use. - Ports: the default RTP range admits about 5000 calls; widen it above that.
The kit is in test/perf/hosts/. MEASURE.md defines
each step, its ladder and its pass line, and the
harness README shows how run.sh drives three real hosts.
From the generator host, the commercial SBC’s test, the
carrier-in ladder, the concurrent-call ladder and
the soak:
cd /opt/freesbc && . test/perf/hosts/env.sh sipp
test/perf/hosts/m03.sh all sipp
test/perf/run.sh -n -s 250:8000:250:40 -H 2 carrier-in
test/perf/hosts/ladder.sh m02 "-c @N@ -H 60 -t 180 -u @N@ call" 250 500 750 1000 1250 1500 2000 2500 3000 4000
test/perf/hosts/m08.sh 3500 8
MEASURE.md runs each one detached with nohup and judges every run with
runcheck.sh and rigcheck.sh. For a quick look on a laptop, the
single-host Docker scenarios still work. Their numbers do
not compare with these.
Code: FreeSBC · docs/performance.md · issue #109